Data analytics in baseball has been well documented. Moneyball was a baseball theory that propelled the Oakland A’s into the playoffs despite a payroll 5 times smaller than the average Major League team. It was also a great movie, with Brad Pitt eating in at least half of the scenes.
But Moneyball was about back-office staff using analytics to build competitive rosters with fewer resources (money for player salaries). It took time for the analytics to boil down to the actual players on those rosters. But now it is a common element of the game.
Players are turning into Abe Lincoln, stuffing paper into their hats like the Gettysburg Address. Or maybe Ben Franklin, with pockets full of sheets like loaves of bread he stole when he arrived in Philadelphia from Boston. Look into the dugout and players are poring over iPads like athletic Steve Jobs.
What’s on that paper? What are they seeing on those iPads? Data visualizations. Fielders use them to see where each different batter tends to hit the ball in different situations[1]. Pitchers use them to see how to pitch to batters in different situations. And hitters use visualizations to determine pitcher tendencies.
There isn’t a lot of time between pitches for players to consume information. That is why data visualizations are the best tool for the job. Each is prepared to communicate intricate data with a glance. And each therefore gives the player their best chance for success.
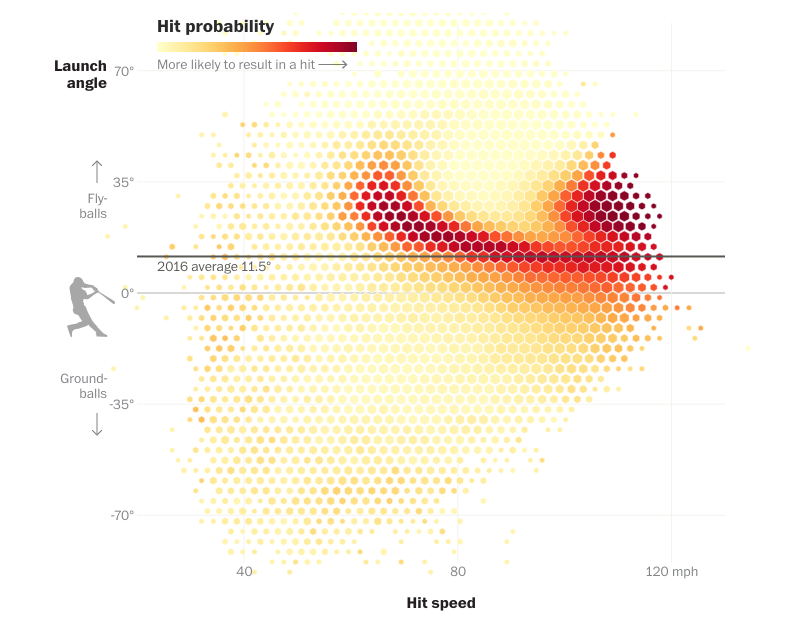
That is all in-game, dealing with individual tendencies on a micro-level. On a macro-level, visual data showed that balls hit with a particular launch angle was a significant determiner of productive at bats[2]. That had a massive impact, changing the way most players approached hitting.

[1] https://www.nytimes.com/2019/05/30/sports/yankees-cheat-sheets.html
[2] https://www.washingtonpost.com/graphics/sports/mlb-launch-angles-story/?utm_term=.9df5db3a7906

